Monitoring
Every machine, watched from two sides.
The pool it hashes to and an agent in the hall both report on your miner. You follow both in your client portal. Our operations team works from the same figures.
Live from our operations systemas of 21:30 GST
6,104
machine capacity
- hashrate capacity
- 1.24EH/s
- power capacity
- 25.4/ 42 MW
This machine's hashrateSample day, drawn from the rules in our operations system
The two signals
What the pool knows, what the hall knows.
From the pool
Status · Hashrate over 15 minutes and 24 hours · Rejected shares · Last share
From the hall
Hashboards and chips · Temperature per board · Fan speed · Pool settings and uptime
One status per machine
Online, or offline and since when · How fresh each signal is
What you see
Your fleet, machine by machine.
Uptime, repairs and the monthly summary, as PDF or CSV, for any period.
Insights
What your miners earn, what hosting costs, and how reliably they run.
Repairs
Every repair in the period: the fault, what was done, days in the workshop and the cost.
Last 30 daysPDFCSVDownloadOnline and uptime
Hours online for each miner, day by day, the lowest uptime and any outages.
Last 30 daysPDFCSVDownloadMonthly summary
Uptime and repairs in one PDF, the same pack we email on the 1st of each month.
Last 30 daysPDFCSVDownload
When a machine stops
Our targets when a machine stops.
Our response ladder
- 02:19+5 min
A rule alert in our console
- 02:29+15 min
A ticket opens and an engineer is assigned
- 03:14+60 min
Priority rises to High
Not reached this night: the fix came first.
- 06:14+240 min
Priority rises to Critical
Not reached this night: the fix came first.
This machine's hashrateSample day, drawn from the rules in our operations system
02:14 · stops hashing
0 TH/s
02:51 · fan replaced, hashing again
Targets our operations team works to, taken from the rules in our operations system. Uptime remains a target in your contract, not a guarantee.
A person decides what happens next: blink, reboot, pool check, hands on the machine, or a repair ticket.
One machine, up close
One machine, as our operations system reads it.
Sample machine with invented figures, drawn from what our operations system reads. Illustration.
Hashing normally, and the pool counts what it sends.
Every board is near its ideal hashrate, every fan turns, and the pool counted 99% of what the machine reports.
Hash path
Hashboards
3 of 3 boards healthy · 330 of 330 chips
- 99%Board 1OK77.9 TH/s
110 of 110 chips working
Board temperature66 °C - 100%Board 2OK78.3 TH/s
110 of 110 chips working
Board temperature68 °C - 99%Board 3OK77.6 TH/s
110 of 110 chips working
Board temperature65 °C
- 4,630 RPMFan 1
- 4,700 RPMFan 2
- 4,620 RPMFan 3
- 4,670 RPMFan 4
What else raises an alert
- A fan under 500 RPM for 3 minutes
- A board at 85 °C (warning) or 95 °C (critical)
- A hashboard fault
- Stopped hashing for 5 minutes
- Under 70% of nameplate for 15 minutes
- Pool disconnected
- Rejected shares over 5%
Targets our operations team works to, taken from the rules in our operations system. Uptime remains a target in your contract, not a guarantee.
What our operations team sees.
Our operations system follows every machine from its hashboards to the pool. These are real screens from it.
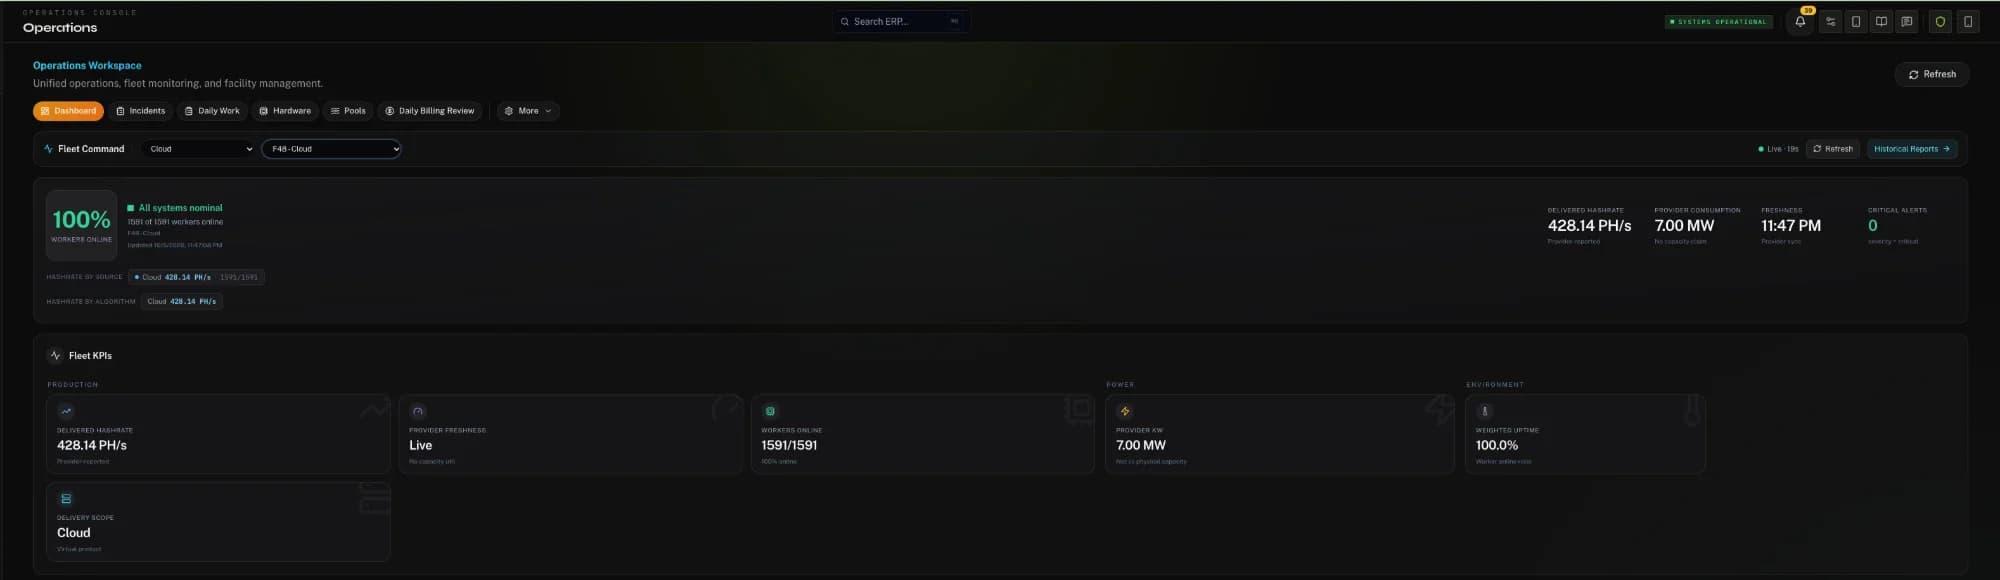
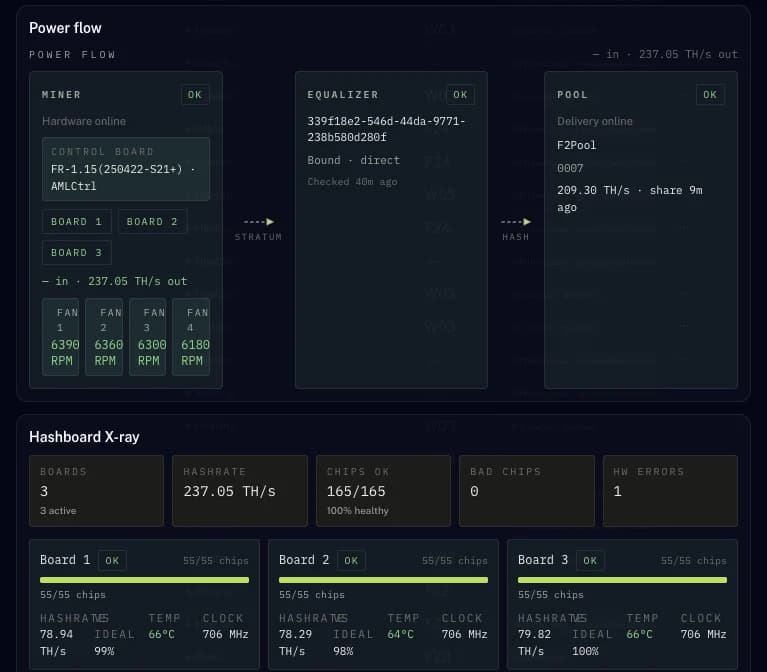
Screens from our operations system on 5 October 2026. Customer details removed.
Uptime
Measured, not claimed.
When the Dubai day closes, our operations system counts every machine's hours.
Sample day, drawn from the rules in our operations system
23.4 of 24 machine-hours hashing
= 97.4%
One day, one bar: the sample machine's day drops into a 90-day strip. The real figures for every centre follow below.
Uptime you can check.
We track every machine around the clock from two sides: the mining pool it hashes to, and an agent running at the site. Uptime is machine-hours hashing divided by machine-hours installed.
- F20Reporting soon
- F21Reporting soon
- F22Reporting soon
- F23Reporting soon
- F24Reporting soon
- F39Reporting soon
- F40Reporting soon
- F48Reporting soon
- F49Reporting soon
- F54Reporting soon
Uptime over the last 30 days for each centre, as our operations system reports it. The daily figures are on the status page.
Machine-hours hashing divided by machine-hours installed, per day, Dubai time. We count the higher of the two signals. Hours with no data count in neither total.
Hosting contracts work to a 95% uptime target, never a guarantee. This is what we measure.
Reporting since 21 August 2026.
What the machines deliver
Nameplate against what the pool credited.
For every model we host with at least 5 machines: the hashrate the pools credited over the last 24 hours, as a share of the figure on the box.
| Model | Machines | Credited, 24 h | Rejected shares |
|---|---|---|---|
| Antminer S21+ | 376 | 94.8% | — |
| Antminer S21 | 130 | 99.4% | — |
| Antminer S21+ Hydro | 59 | 94.9% | — |
| Antminer S19k Pro | 38 | 101.8% | — |
| Avalon 1466 | 38 | 98.5% | — |
| Antminer S21 XP | 35 | 97.9% | — |
| Antminer S21 Pro | 17 | 97.9% | — |
| Antminer S21 XP Hydro | 17 | 97.8% | — |
| Antminer S19 XP+ Hydro | 15 | 98.4% | — |
| Avalon A15 | 10 | 120.0% | — |
1851 machines in the benchmark, 97.7% median across them.
From our operations system, as of 21:20 GST. Credited hashrate from the pools, machine by machine, over the last 24 hours.
Included, and not
What comes with hosting, what you ask us for, and what we don't offer.
Included with hosting
Both signals on every machine. The client portal and its alerts. Reports, and an uptime PDF with every invoice. Cleaning and routine maintenance on site.
By request
A pool change. A reboot or a power mode, where the machine's firmware allows it. A repair, with an estimate to approve first. A return. Repairs after the maker's warranty are quoted before any work.
Not offered
Remote firmware updates. Client-side control of the machine. API keys: a signed webhook to your own system is available instead.
Questions about monitoring
How is uptime calculated, and where can I check it?
Uptime is machine-hours hashing divided by machine-hours installed, per day, Dubai time. For each machine our operations system counts the higher of the two signals; hours with no data count in neither total. Your own machines' uptime is in the portal and in the PDF that comes with every invoice. The uptime of every centre is on our status page.
How do you know my machine stopped, and how fast do you react?
When a machine stops hashing, both signals show it within minutes: the pool stops receiving shares, and the agent in the hall reads the stop from the machine itself. Our operations console raises an alert and opens a ticket. An engineer checks the machine in the hall and decides: a reboot, a pool check, hands on the machine, or a repair ticket. Response times are targets our team works to, not a guarantee.
Which pools can I use, and can I change my pool?
Your machines hash to SegPool or to the pool you name. Our operations system reads workers from F2Pool, ViaBTC, NiceHash, 21Pool, 2Bminer and SegPool. To change your pool, file a request in the portal: our team carries it out and the portal tells you when it is done.
Will I get an alert on WhatsApp?
Miner alerts reach you in the portal, and by email if you switch it on. For the notification types the portal offers, such as billing, pool changes, repairs and facility updates, you can add WhatsApp as a channel.
Can my partner or accountant see my fleet?
The portal has one login per client. Reports download as PDF or CSV, so you can pass on the uptime report, the monthly summary or your fleet list. If you need separate access for a partner, ask us on WhatsApp.
What reports do I get, and how often?
An uptime PDF comes with every invoice. In the portal you can download, for any period, the repairs report, the online and uptime report, the monthly summary and your fleet list as CSV. The monthly summary is also emailed on the 1st of each month.
What happens if the agent in the hall is down?
The pool signal still counts. For each machine-hour we take the higher of the two signals, so a gap in the agent's data does not count against your uptime. Hours with no data from either side count in neither total.
Send us your machine list.
We reply with a hosting quote. Every hosting client gets an account on the client portal.